



Home › Blog › Sunshine hours
Updated monthly
Last update October 7, 2026
Sunshine hours in Belgium 2026
How sunny has the year been so far, and what does that mean for the yield of your solar panels? Every month, we compare the RMI sunshine hours with the normal values. This allows you to see at a glance whether your installation should have yielded more than usual and what you should look out for. Photo: Charlie Joe
1,705 h
sun through September 2026
109%
of a completely average year, after nine months
8 of 9
months sunnier than normal
307 h 51
in July, the sunniest month of the year
Month by month
Click on a month for the full analysis.
Year counter: 1,705 of an average 1,564 hours 109%
Monthly analysis
September 2026
157 h 21 sun, normal 154 h 27 2% more sun than normalSeptember was a warm and dry month with just slightly more sun than normal. At 100.2 kWh/m², solar radiation was clearly above the normal 92.7 kWh/m². This means that after nine months, 2026 is already sunnier than a completely average year.
The drought is particularly striking: barely 18.4 mm of rain, among the five lowest values since 1991. After the extremely dry month of July, this is already the second month with very little rain, causing dust and dirt to remain on your panels. Now that the days are getting shorter, every percentage of efficiency counts. A cleaning and inspection before winter will ensure your installation is ready for the dark months.
- Solar radiation: 100.2 kWh/m² (normal 92.7)
- Precipitation: 18.4 mm (normal 65.3)
- Average temperature: 17.4 °C (normal 15.2)
More sun only means more yield if your installation cooperates
Dirt, a faulty string, or an inverter that occasionally cuts out: many owners only notice it on their annual bill. Here is how you ensure every sunshine hour counts.
Monitoring
See immediately if your yield is correct
With Solar COMFY, we monitor your installation 24/7. If the production deviates from what the sun promised, we will contact you ourselves. Discover Solar COMFY →
Cleaning
After a dry summer: have your panels cleaned
Without rain, dust and pollen remain on your panels. You can't see that loss of efficiency with the naked eye, but you can see it in your figures. Discover cleaning →
Breakdown assistance
Malfunction? Productive again quickly
In a sunny month, every day of downtime costs extra. Our technicians will be on-site within 48 hours. Discover breakdown assistance →2025 Review: an exceptionally favorable solar year
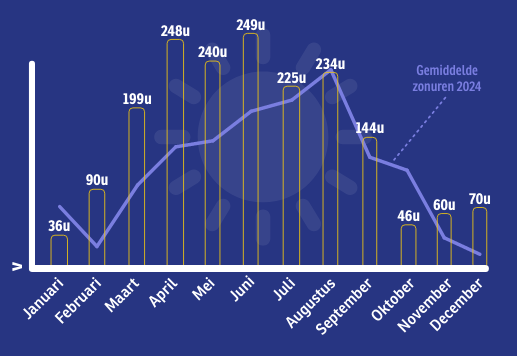
Many sunshine hours, high radiation, and predominantly dry weather ensured a clear surplus yield in 2025. Installations ran more stably and produced noticeably more than in 2024, resulting in a faster payback time.A good solar year is positive, but only when your installation actually performs optimally. Without monitoring or maintenance, you could still miss out on yield.
Frequently Asked Questions
How many sunshine hours does Belgium have per year?
Approximately 1,564 hours on average, measured in Uccle. The actual number fluctuates every year, which is why we track it month by month.
Where do these figures come from?
From the monthly reports of the RMI, Uccle measuring station. The normal value is the average over the period 1991 to 2020.
Does more sun always result in more power?
Only if your installation is working correctly. Efficiency of panels drops at high temperatures, and dirt or a malfunction can completely negate the extra sun.
How do I know if my installation is yielding enough?
Compare your monthly production with the sunshine hours on this page. If your yield this summer was not clearly higher than normal, a check is worthwhile.